
Introduction
This blog post is going to cover using the log aggregation tooling Grafana Loki to aggregate logs from your pods within Kubernetes, something I’ve been keen to try out for awhile as I’m a elasticsearch man so I’m looking forward to delving into what Loki has to offer as it’s being revered across the lands as a real competitor!
Prerequisites
- A Kubernetes Cluster ( Can be either On-Prem, AKS, EKS, GKE, Kind ) - I’m using minikube!
- Helm, kubectl installed.
Firstly, let’s talk…
What is Grafana Loki?
Loki is a horizontally scalable, highly available, multi-tenant log aggregation system inspired by Prometheus. It is designed to be very cost effective and easy to operate. It does not index the contents of the logs, but rather a set of labels for each log stream.
The Loki project was started at Grafana Labs in 2018, and announced at KubeCon Seattle. Loki is released under the AGPLv3 license.
Grafana Labs is proud to lead the development of the Loki project, building first-class support for Loki into Grafana, and ensuring Grafana Labs customers receive Loki support and features they need.
So there you have it it’s a scalable log aggregation system, alright now you want to know..
What is a log aggregation system
Log aggregation is the process of collecting, standardizing, and consolidating log data from across an IT environment in order to facilitate streamlined log analysis.
Hopefully that answers some of your questions.
Loki works in the following way:
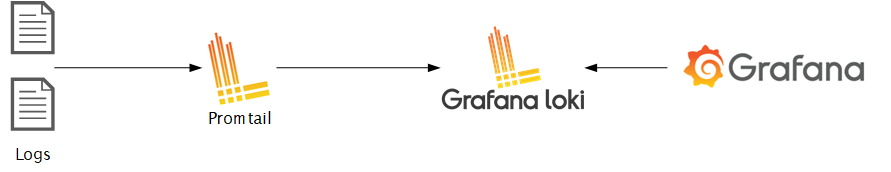
- Promtail - The client which fetches and forwards the logs to Loki. It is a good fit for Kubernetes as it automatically fetches metadata such as pod labels.
- Grafana - A visualization tool that supports Loki as a data source.
Lets get started!
Installing Loki, Promtail, Prometheus Operator
For this blog post and to make things concise and easy we are going to use Helm to deploy the loki architecture, I won’t go into too much detail about what helm is just know that its cool.
The Loki stack helm chart supports the installation of various components like promtail, fluentd, Prometheus and Grafana.
Create a Kubernetes namespace to deploy the PLG Stack to:
kubectl create namespace loki
Add the Grafana Helm Repo
helm repo add grafana https://grafana.github.io/helm-charts
"grafana" has been added to your repositories
Run a helm update
helm repo update

Hang tight while we grab the latest from your chart repositories...
...Successfully got an update from the "grafana" chart repository
Update Complete. ⎈Happy Helming!⎈
Now install the Loki helm chart with the below parameters:
helm upgrade --install loki grafana/loki-stack --namespace=loki --set grafana.enabled=true,prometheus.enabled=true,prometheus.alertmanager.persistentVolume.enabled=false,prometheus.server.persistentVolume.enabled=false

Release "loki" does not exist. Installing it now.
W0713 14:22:15.416496    8217 warnings.go:70] policy/v1beta1 PodSecurityPolicy is deprecated in v1.21+, unavailable in v1.25+
W0713 14:22:15.418323    8217 warnings.go:70] policy/v1beta1 PodSecurityPolicy is deprecated in v1.21+, unavailable in v1.25+
W0713 14:22:15.419864    8217 warnings.go:70] policy/v1beta1 PodSecurityPolicy is deprecated in v1.21+, unavailable in v1.25+
W0713 14:22:15.515327    8217 warnings.go:70] policy/v1beta1 PodSecurityPolicy is deprecated in v1.21+, unavailable in v1.25+
W0713 14:22:15.515607    8217 warnings.go:70] policy/v1beta1 PodSecurityPolicy is deprecated in v1.21+, unavailable in v1.25+
W0713 14:22:15.516327    8217 warnings.go:70] policy/v1beta1 PodSecurityPolicy is deprecated in v1.21+, unavailable in v1.25+
NAME: loki
LAST DEPLOYED: Wed Jul 13 14:22:14 2022
NAMESPACE: default
STATUS: deployed
REVISION: 1
NOTES:
The Loki stack has been deployed to your cluster. Loki can now be added as a datasource in Grafana.

See http://docs.grafana.org/features/datasources/loki/ for more detail.
You should be able to see the loki stack deployed to your cluster under the default namespace:
kubectl get deployments -nloki
NAME                           READY   UP-TO-DATE   AVAILABLE   AGE
loki-grafana                   0/1     1            0           45s
loki-kube-state-metrics        0/1     1            0           45s
loki-prometheus-alertmanager   0/1     1            0           45s
loki-prometheus-pushgateway    1/1     1            1           45s
loki-prometheus-server         0/1     1            0           45s
You’ll need to wait a few moments til that READY is 1/1.
Eventually it’ll look like:
NAME                           READY   UP-TO-DATE   AVAILABLE   AGE
loki-grafana                   1/1     1            1           5m23s
loki-kube-state-metrics        1/1     1            1           5m23s
loki-prometheus-alertmanager   1/1     1            1           5m23s
loki-prometheus-pushgateway    1/1     1            1           5m23s
loki-prometheus-server         1/1     1            1           5m23s
Logs logs logs!
Now you have the install setup lets grab the default admin username and password:
kubectl get secret loki-grafana -o go-template='{{range $k,$v := .data}}{{printf "%s: " $k}}{{if not $v}}{{$v}}{{else}}{{$v | base64decode}}{{end}}{{"\n"}}{{end}}' -n loki

admin-password: REDACTED
admin-user: admin
ldap-toml:
Now forward the port so you can access the grafana instance locally:
kubectl port-forward --namespace loki service/loki-grafana 30080:80
In your browser open http://localhost:30080
You should be prompted by the grafana login which you can enter the defaults from above!
If you go to settings > data sources you will find its already setup the loki data source.

Next, click on the Explore tab on the left side. Select Loki from the data source dropdown.
In the log browser field paste {container="kube-apiserver"}

This will return the logs for the kube-apiserver.
Now lets create a dummy box that just echos some fun stuff:
kubectl create deploy loki-medium-logs --image=busybox -- sh -c 'for run in $(seq 1 10000); do echo "Howdy $run"; sleep 2; done'
If I follow the deployment logs for the above you see:
kubectl logs -f deployment.apps/loki-medium-logs ✔ at minikube ⎈ at 14:52:42
Howdy 1
Howdy 2
Howdy 3
Howdy 4
Howdy 5
Howdy 6
Howdy 7
Howdy 8
Howdy 9
BUT can I see them in Loki Lets find out…
In the query box search for {app="loki-medium-logs",namespace="default"} and there they are:

Conclusion
This was a brief and quick run through of how I managed to get loki setup with relatively little headache and view the logs for my instances which is pretty awesome! you can then carry on further and create pretty dashboards and more intense queries.
I’d recommend digging into the query language which is called LogQL more on that can be found here: https://grafana.com/docs/loki/latest/logql/
Happy logging!
Post Credits
https://medium.com/nerd-for-tech/logging-at-scale-in-kubernetes-using-grafana-loki-3bb2eb0c0872 https://codersociety.com/blog/articles/loki-kubernetes-logging